Personal Finance App Frontend
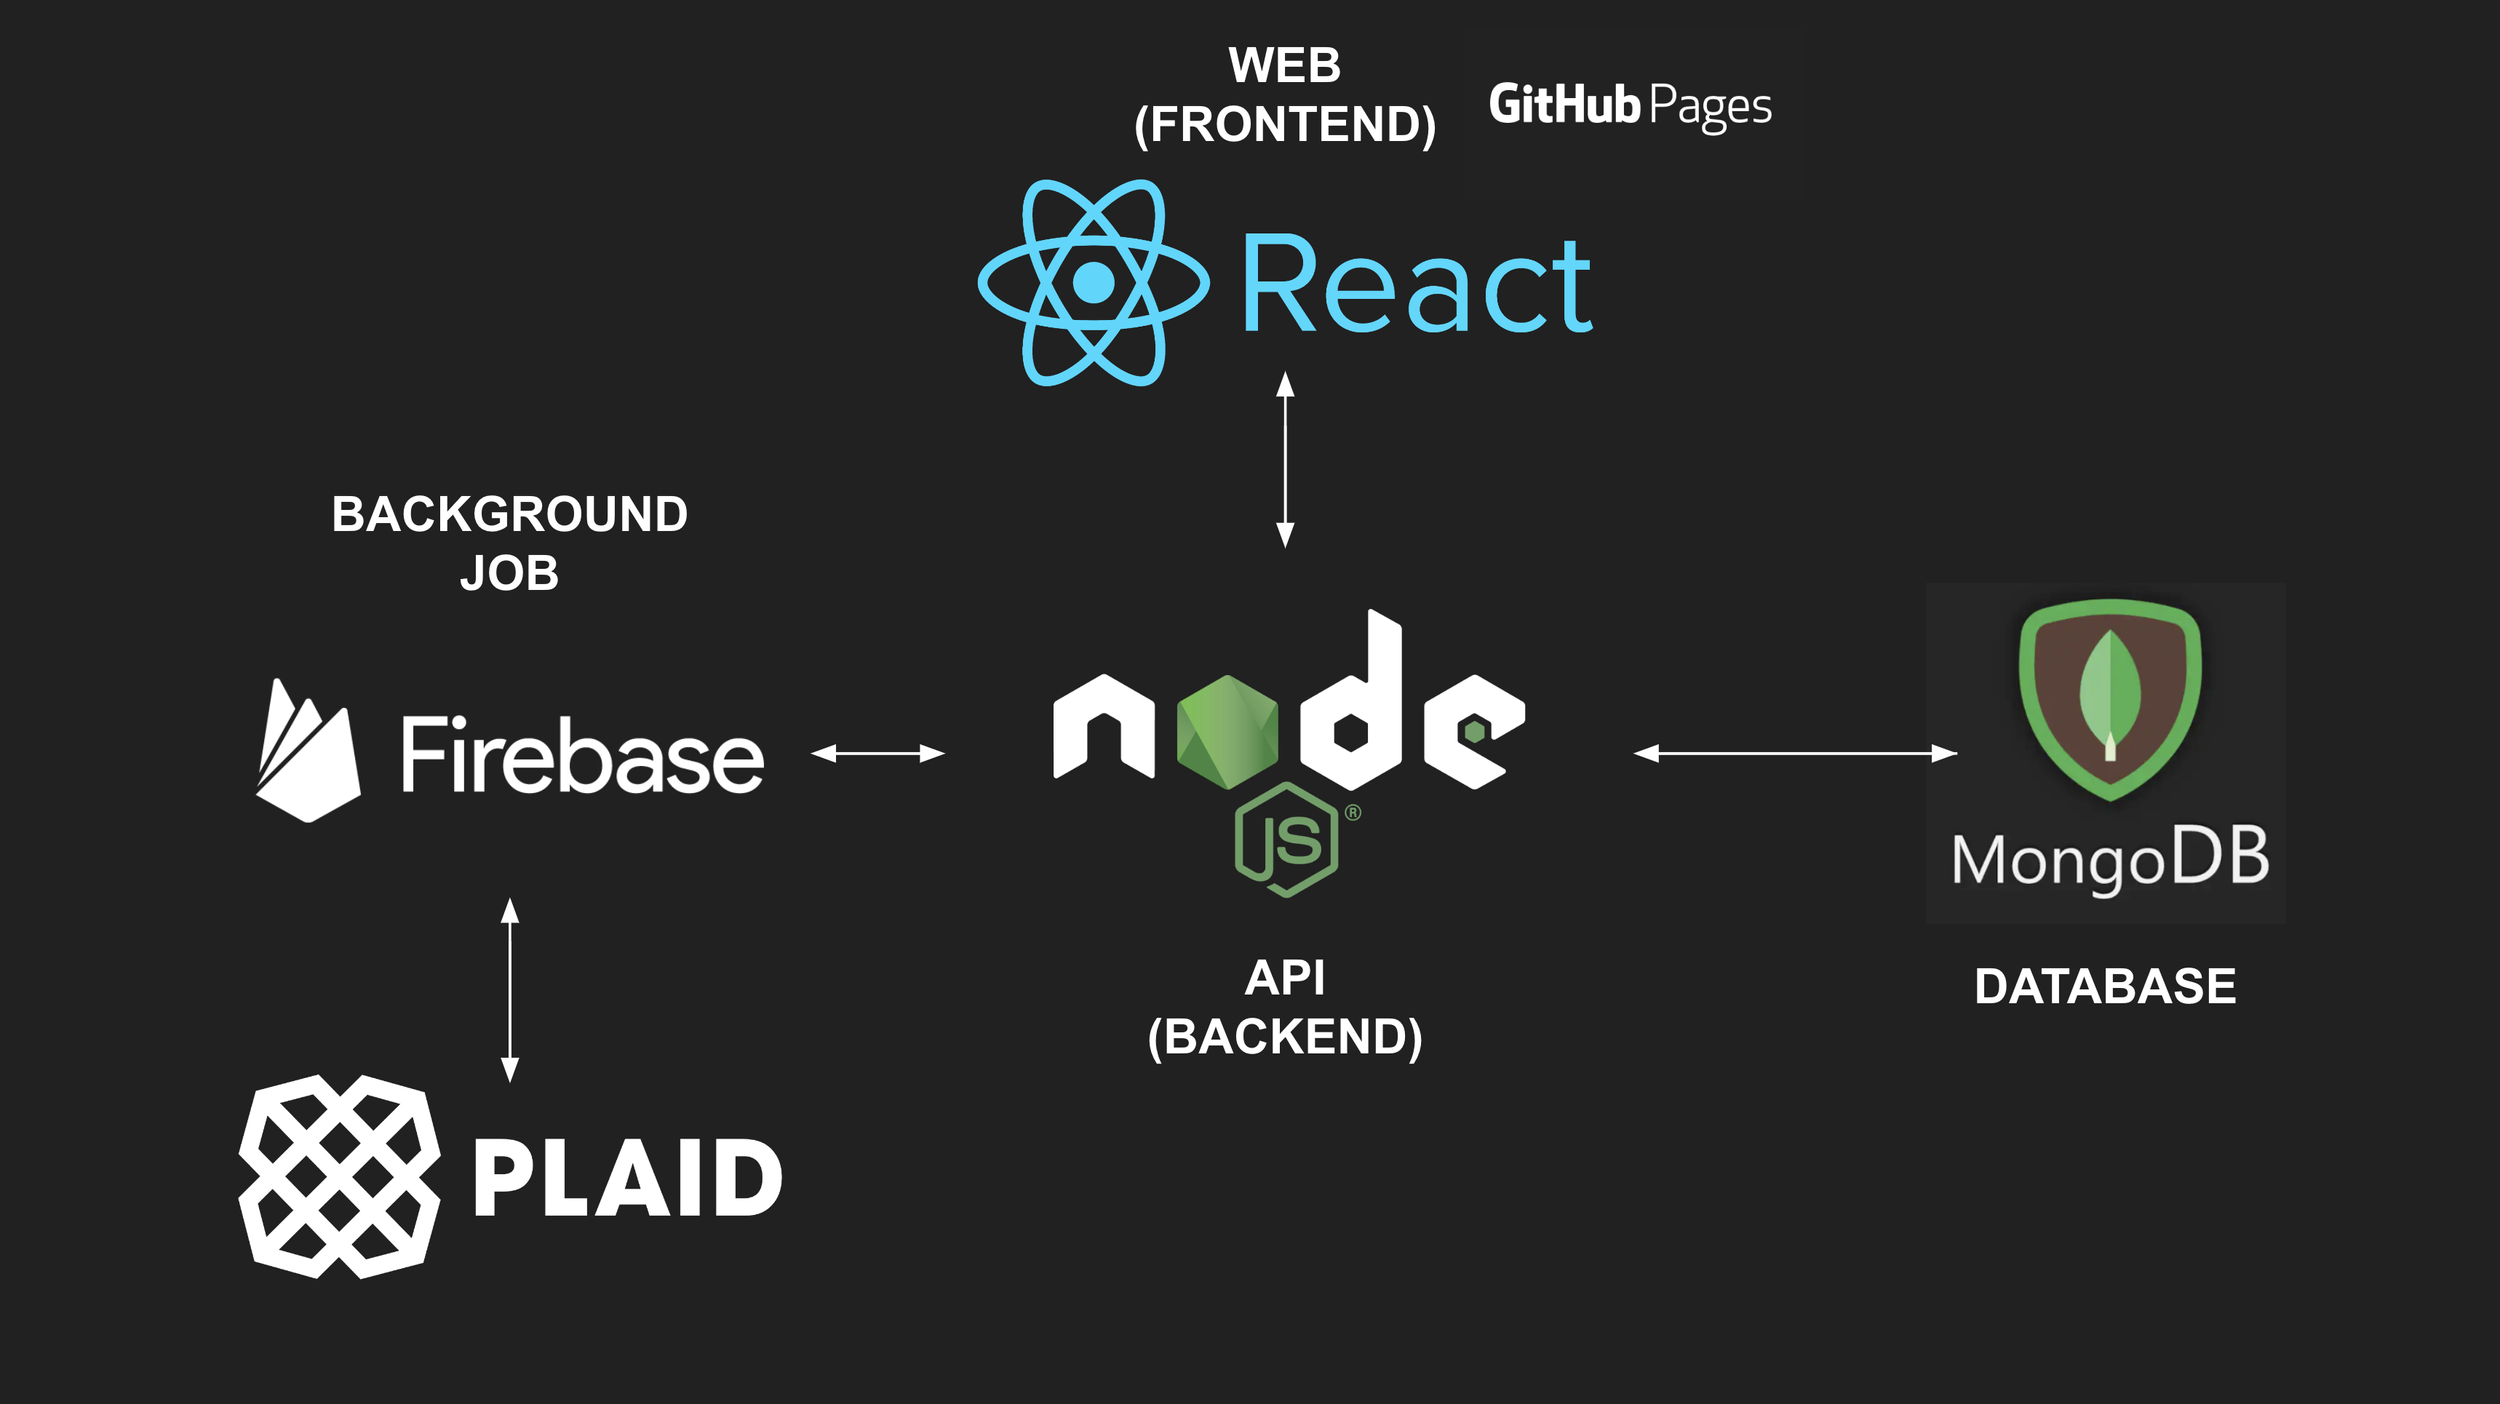
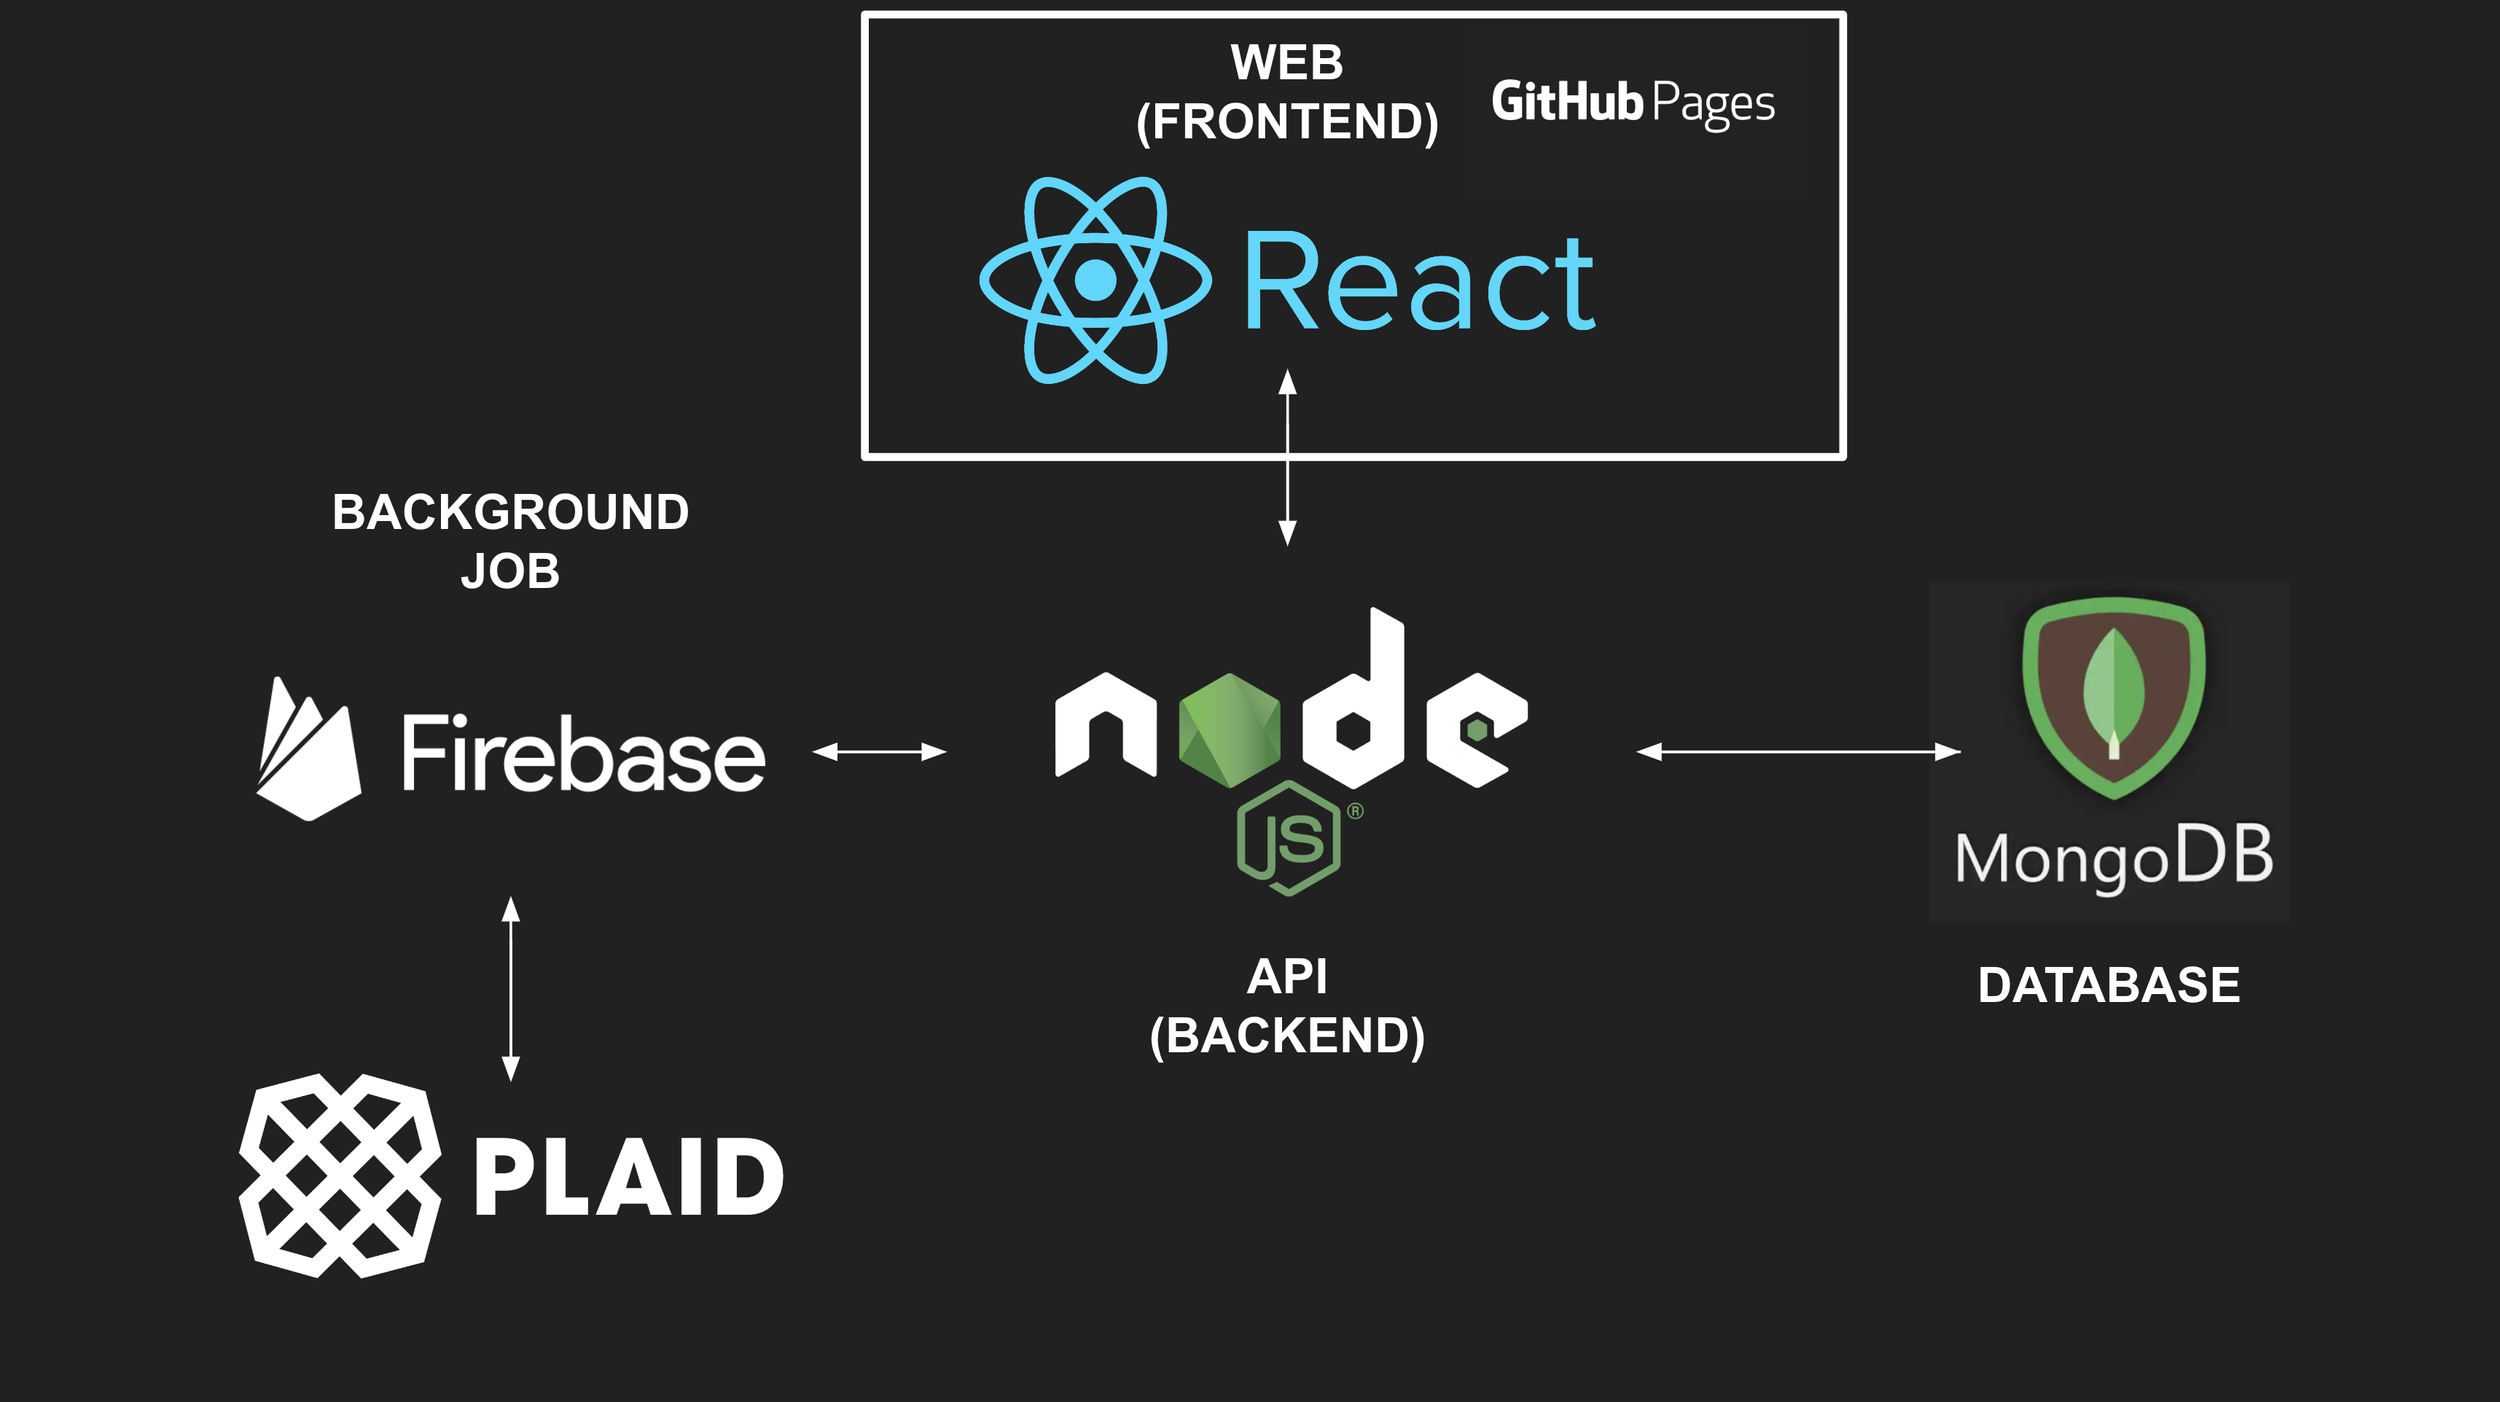
Personal Finance App Technical Design Diagram
Frontend (boxed in white)
💾 Source Code
* the source code is not a working solution but a reference to help you get started
🧩 Components
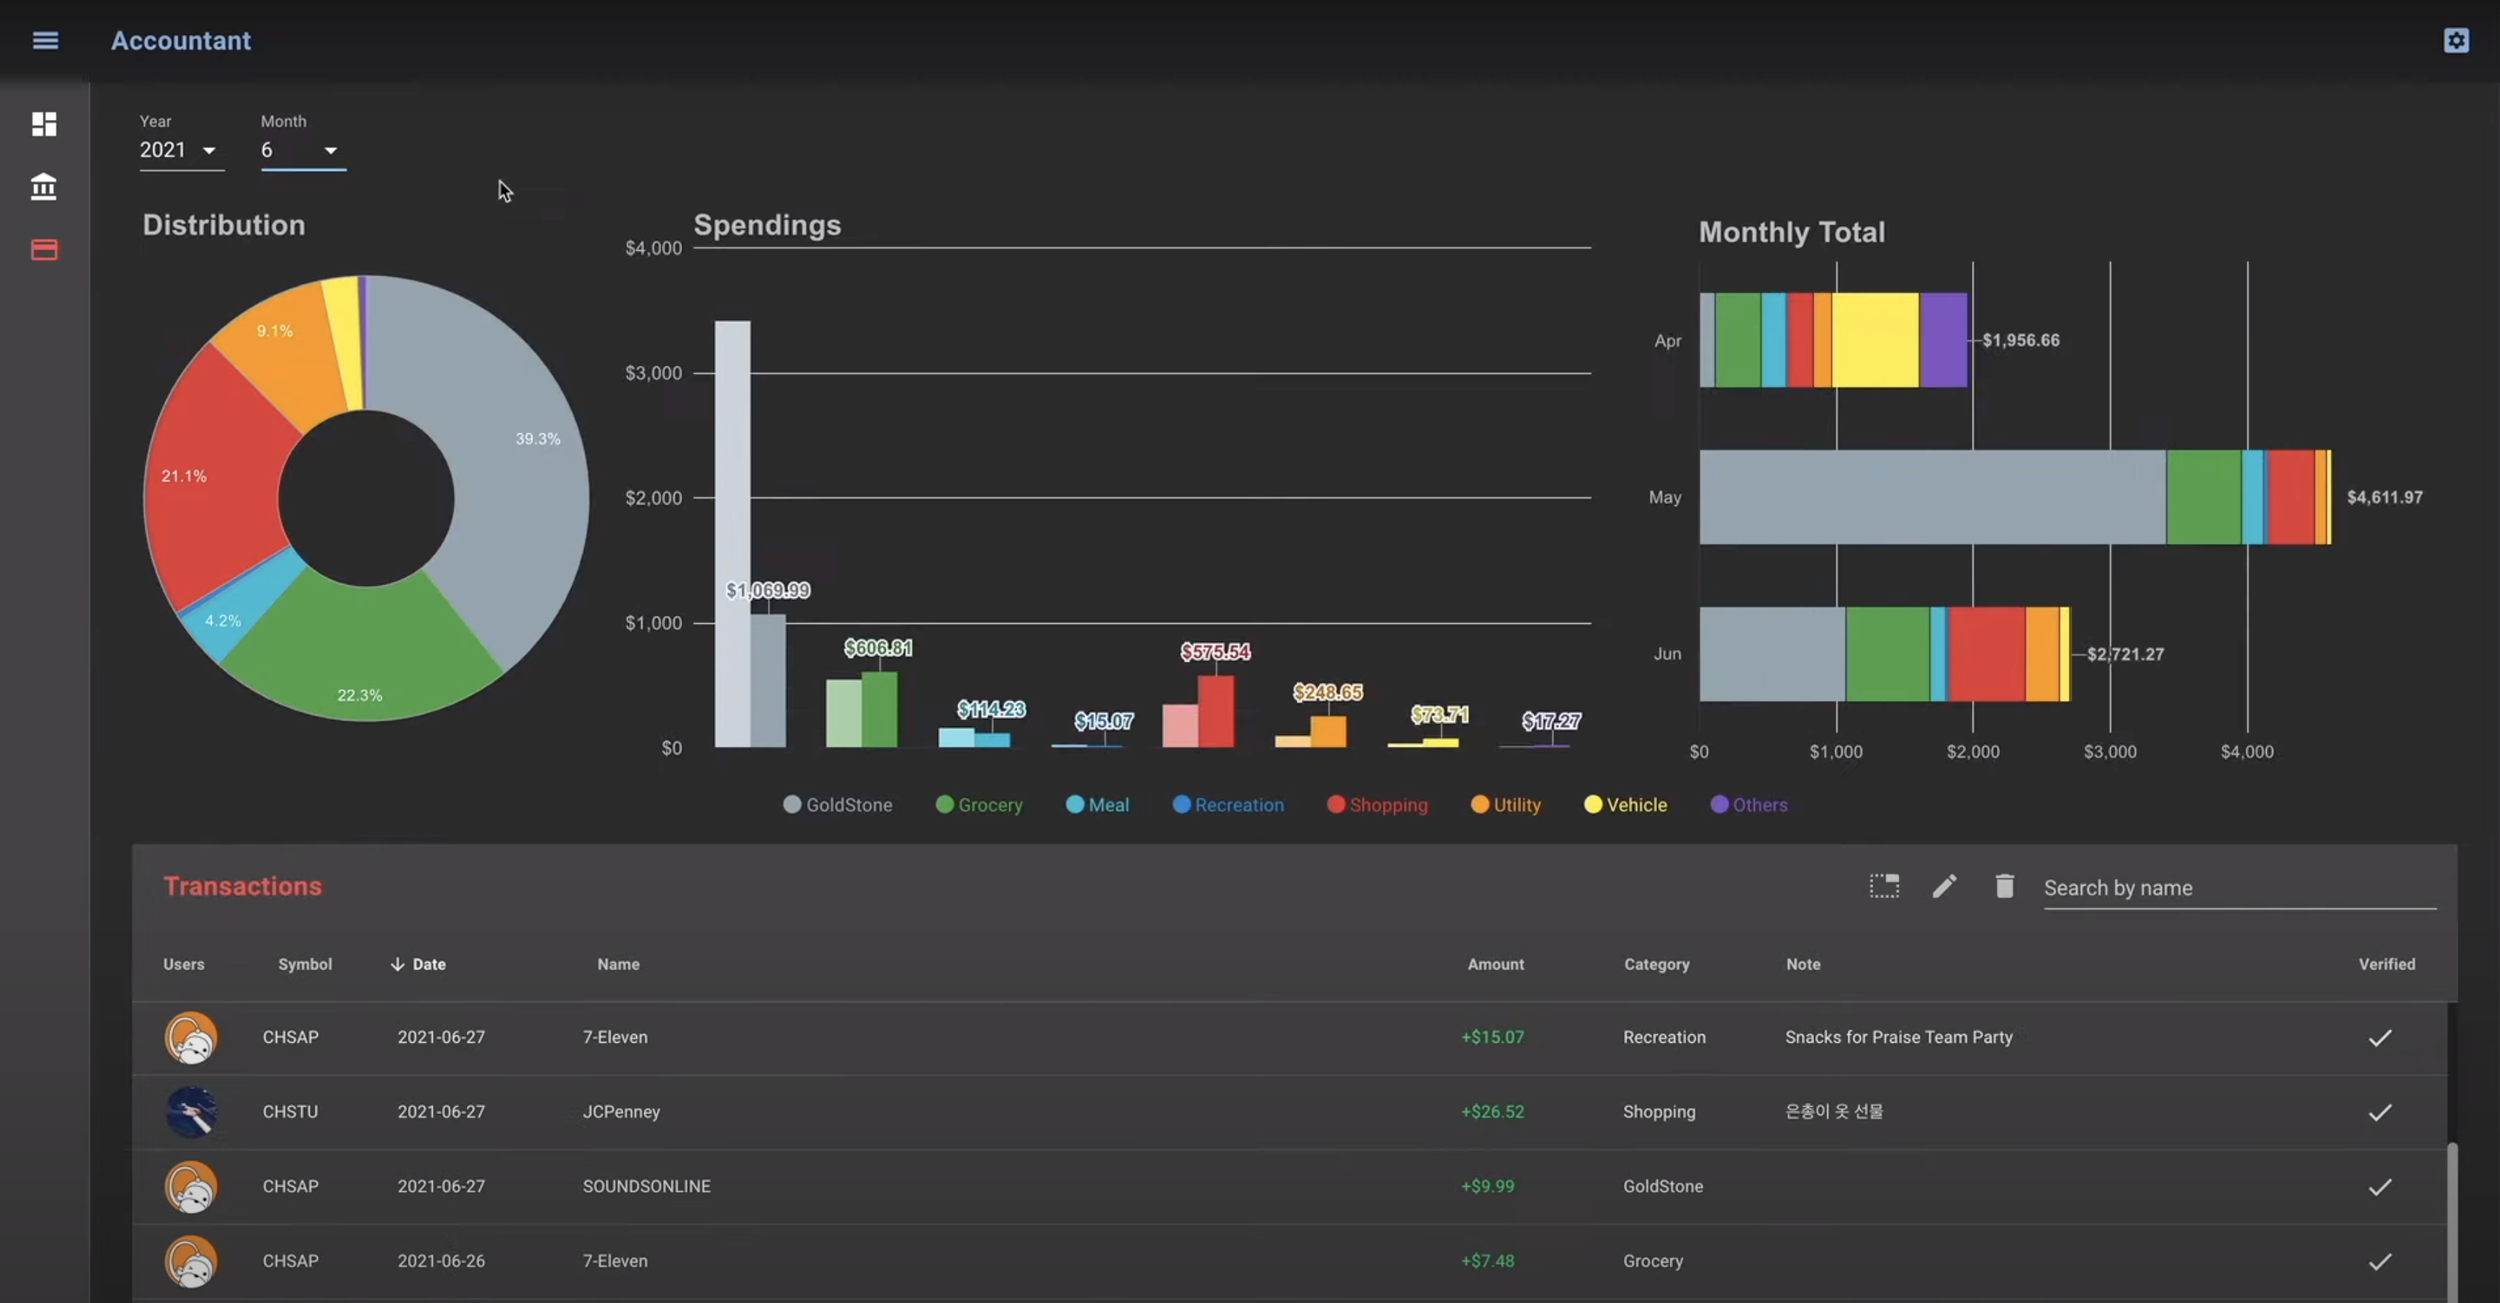
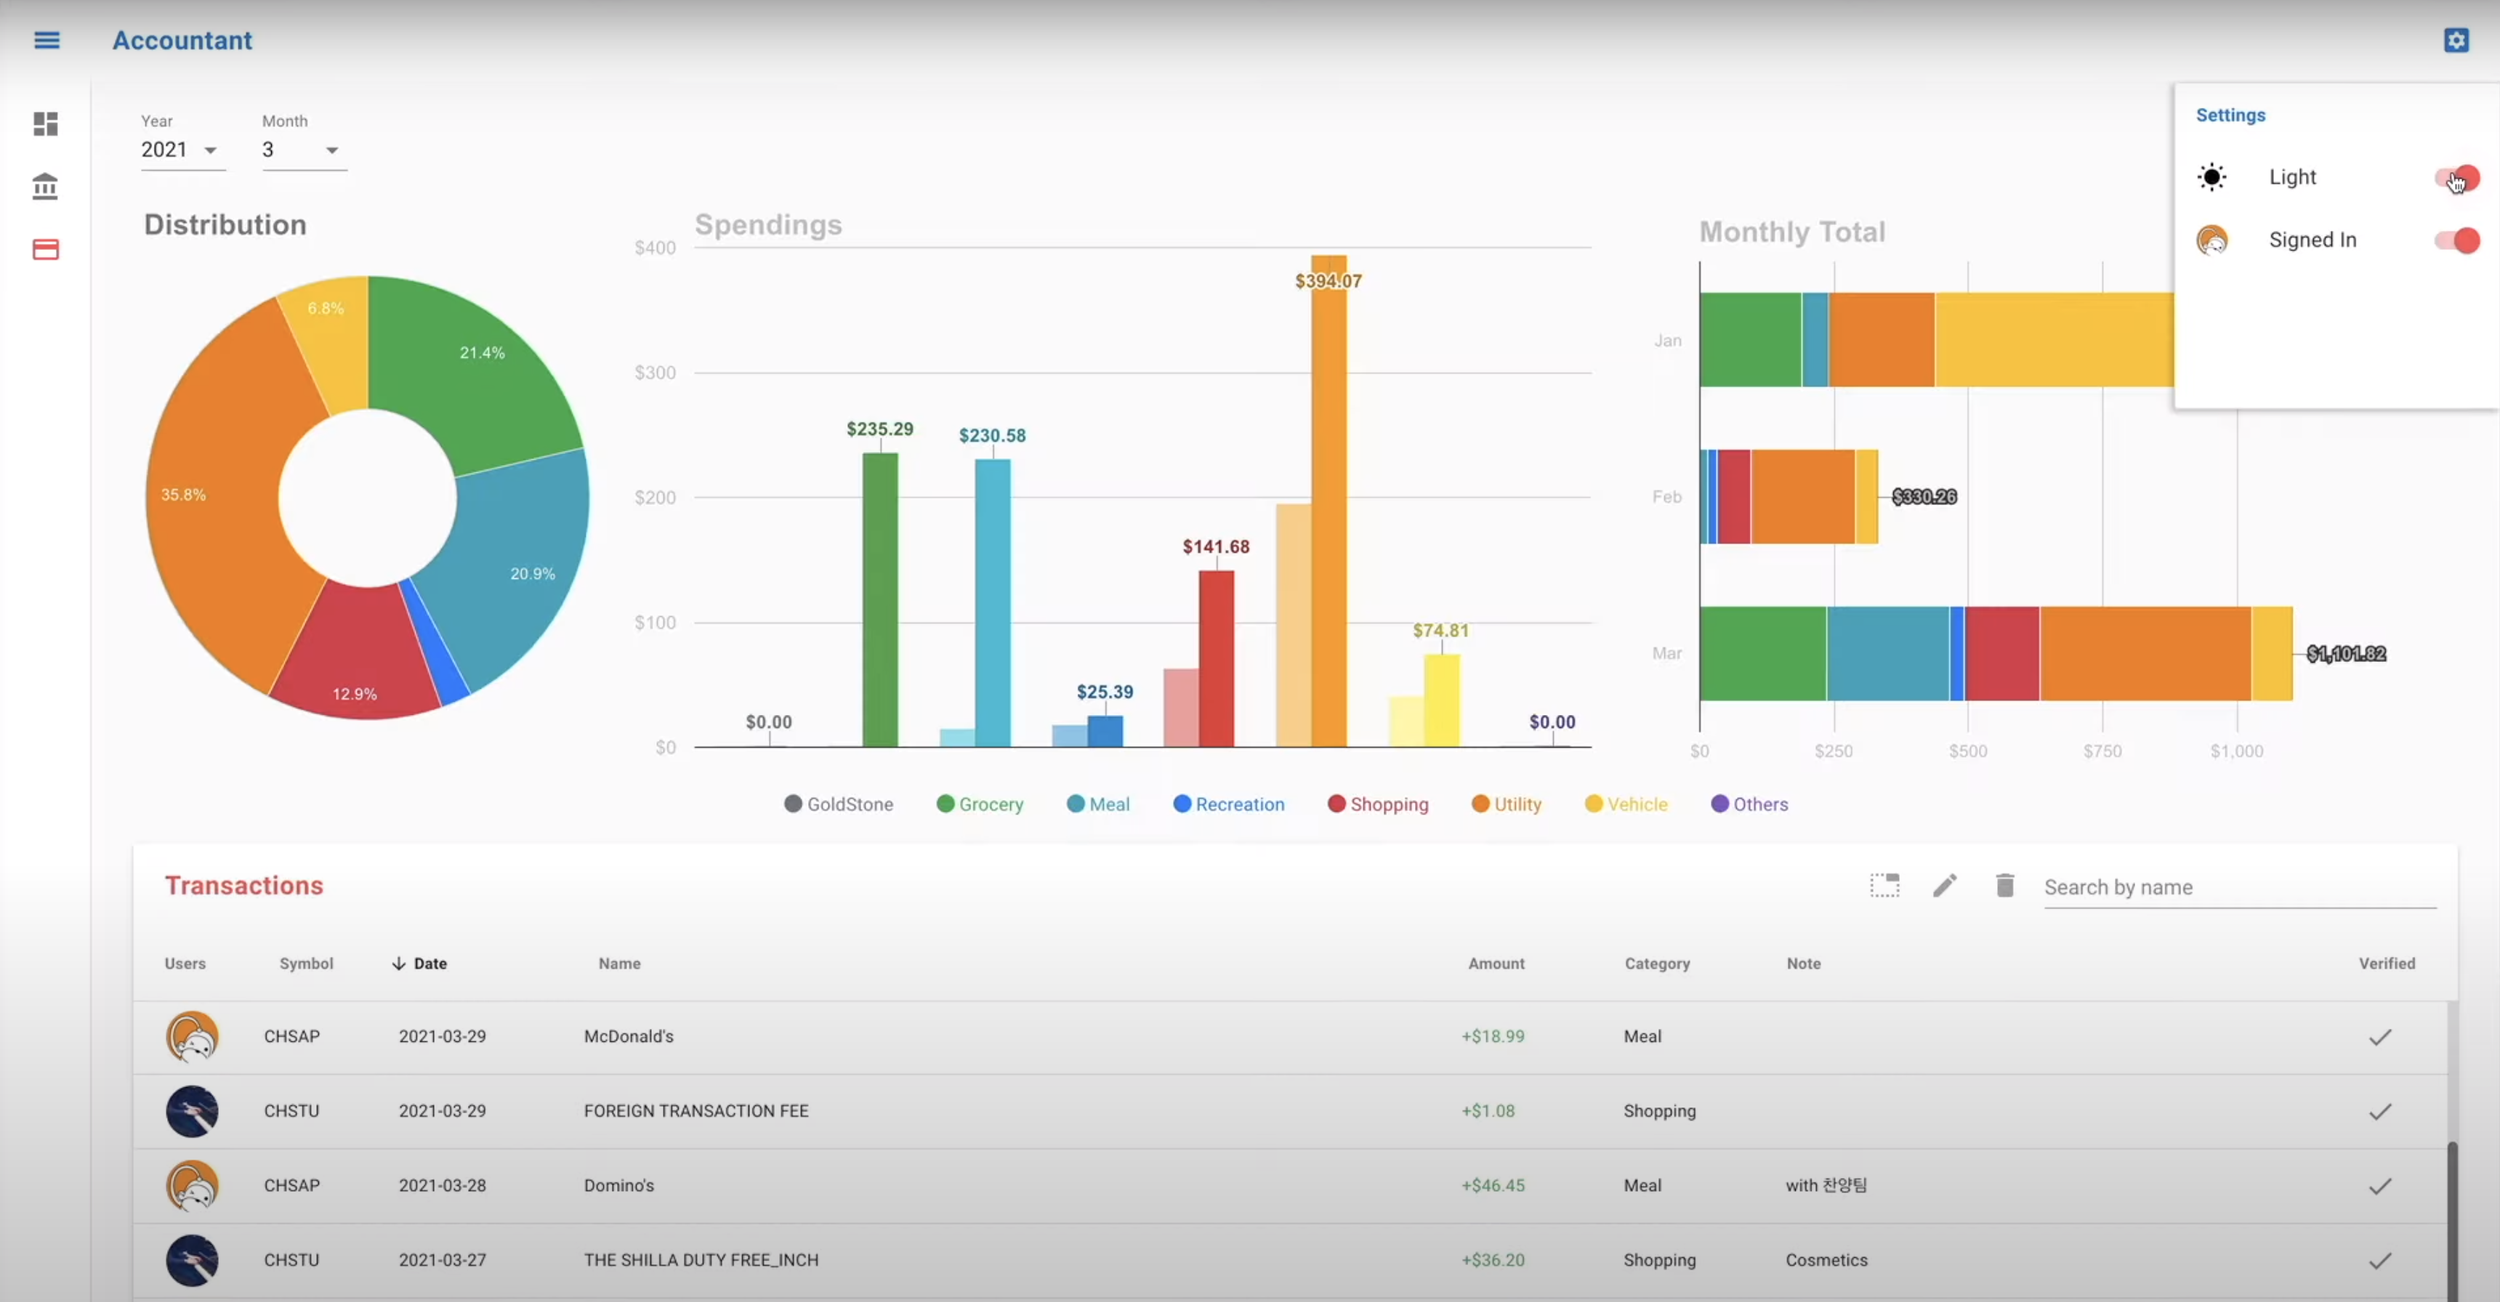
Bookkeeping (Expense Management)
Aggregate the monthly expense data
Categorize the expenses (e.g. grocery, meal, shopping, utility, recreation, etc.)
Use a Pie Chart to visualize the expense type allocations (distribution)
Use a Column Chart to visualize the total spending by category in a month (including a comparison column for the previous month)
Use a Stacked Bar Chart to visualize the last three months’ total spending
Net Worth Tracker (Assets Management)
Aggregate the daily balance for all asset accounts (e.g. bank, stock, cash, etc.)
Categorize the assets (e.g. liquid, medical, retirement, cash, etc.)
Use a Line Chart to visualize the change in your daily net worth over time
🛠 Development
* This guide assumes an intermediate level of JavaScript and coding in general
Use React with Hooks for developing the frontend.
Use Axios to communicate with the backend (node.js) server.
Do NOT call Plaid directly from the frontend. You want your backend to do that.
Integrate with JavaScript charting APIs for data visualization.
Bonus
Integrate with Google Sign-In for gmail authentication
Try playing around with Light & Dark themes
▶️ YouTube Tutorials
JavaScript Crash Course by Traversy Media
JavaScript ES6, ES7, ES8 by freeCodeCamp.org
ReactJS Crash Course by Traversy Media
React Router v6 by Traversy Media
GitHub Pages Deploy & Domain by Traversy Media
Optional
HTML Crash Course by Traversy Media
CSS Crash Course by Traversy Media
TypeScript Crash Course by Traversy Media
🚀 Utilities
MaterialUI - Styling
Lodash - JavaScript Utilities
Axios - JavaScript HTTP Client (for calling the backend)
Chart.js - Data Visualization
Google Charts - Data Visualization
Google Sign-In - gmail Authentication
🛸 Resources
Personal Finance App Backend - Server Side Implementation
Learn to Code for Free - PK’s Bookkeeping App
Plaid - Financial Data API Provider
Visual Studio Code - Code Editor